
A rising market with a fractured foundation
On the surface, 2026 looks like a good year. Beneath those headline returns, progress has been uneven. Leadership has repeatedly changed as investors responded to war, inflation and uncertainty about AI spending. The distinction matters because an index return can make investing look easier than it has felt. A portfolio built around a client’s income requirements and tolerance for losses may behave differently. Our response is to examine what is driving returns and whether those drivers offer a durable foundation.
A rising index does not describe every investor’s experience. Our analysis puts 57% of S&P 500 companies at least 10% below their highest closing price over the past 52 weeks, compared with approximately 70% in mid October cited by Scotia Global Asset Management.
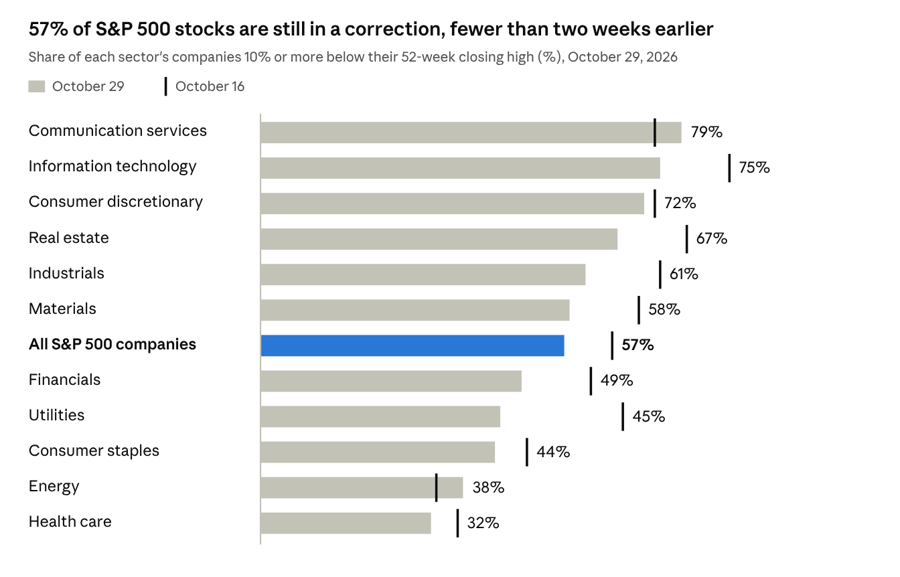
Measured against their highest historical closing prices, 54% are more than 20% below their peaks and 16% have lost at least half their value. Only about a quarter sit within 5% of their 52 week highs. The median stock has gained roughly 9% this year, compared with 13% for the index, and approximately one third are down.
These measures describe different aspects of the market. A company can be positive for the year while remaining well below an earlier peak. The message is that strong headline returns coexist with substantial weakness underneath.
Our sector breakdown also points to uneven damage: 75% of technology companies were in a correction, compared with 38% of energy companies. This reinforces the difference between a successful investment theme and the experience of every company associated with it. Sector labels alone tell us relatively little about individual risk.
Sources: Original Quotestream Data, breadth calculations through October 29, 2026; Scotia GAM Macro Musings dated October 27, 2026 as cited in the original
Energy and A.I. drove the gains
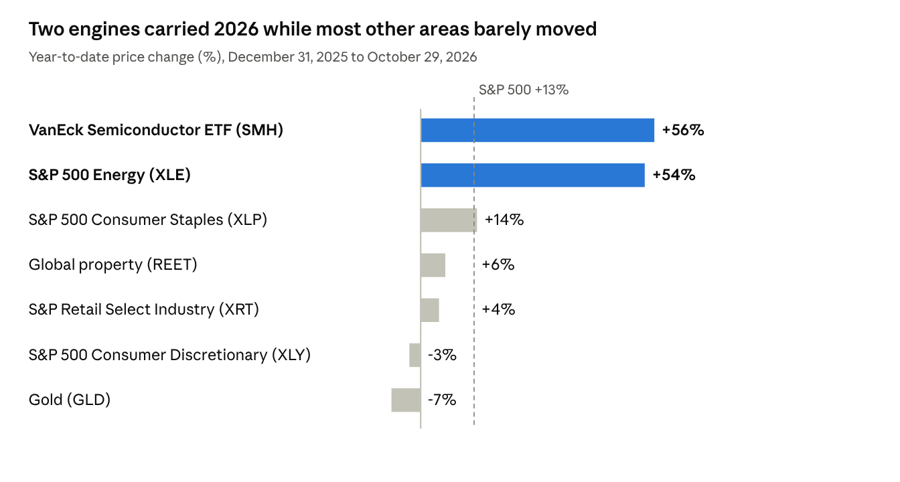
Energy and semiconductors have stood apart. Through October 29, the VanEck Semiconductor ETF, SMH, gained approximately 56%, while the Energy Select Sector SPDR ETF, XLE, rose about 54%. Among the other selected investments, returns ranged from a 7% decline for the gold fund GLD to a gain of approximately 14% for consumer staples.
Our attribution estimates that ten companies generated 54% of the S&P 500’s advance from March 30 through October 29. Apple, Microsoft and Nvidia together accounted for about 31%. That concentration helps explain how the index could remain strong while many constituents struggled. Scotia’s earlier estimate suggested even narrower leadership before participation improved.
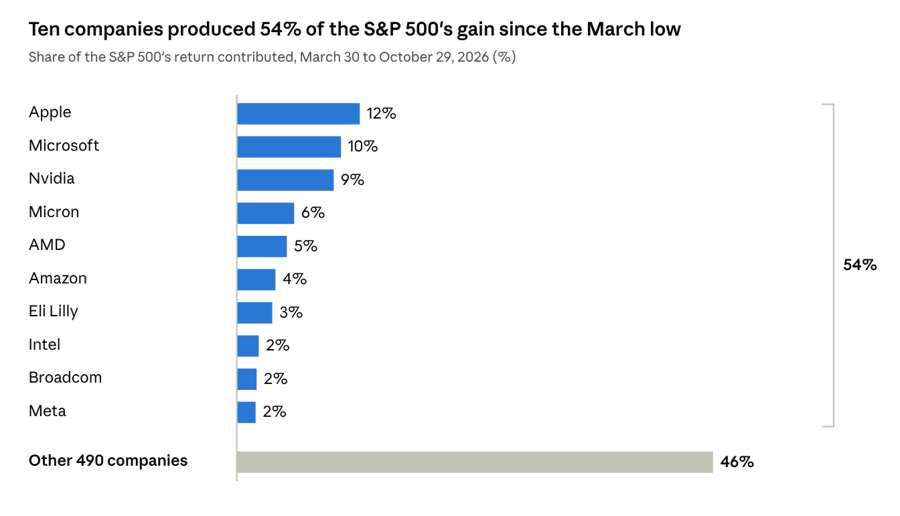
The comparison matters for portfolio construction. Owning a broad selection of businesses can produce a very different experience from owning the largest contributors to a weighted index. Concentration can lift returns quickly, but it also makes results more sensitive to disappointments in a small group.
Consumer staples have roughly matched the index among the selected comparisons, offering an example of strength outside the dominant themes. Still, the gap between the leading funds and the rest is large. We want to recognize that gap without assuming it will persist indefinitely or justify paying any price for growth.
Sources: Quotestream Dataclosing prices and original attribution calculations; Scotia GAM Macro Musings dated October 27, 2026 as cited in the original
Canada shows a similar but different split
Canada’s market tells a similar story, with banks and oil producers playing the leading roles. The TSX is up approximately 14% and sits about 2% below its August closing record. Our analysis of 215 companies places 55% at least 20% below their historical highs. The median company is up roughly 7%, while 38% are down this year.
Our attribution assigns 5.9 percentage points to the Big Five banks and 5.1 points to energy, led by Canadian Natural, Suncor and Cenovus. Together, that equals approximately 77% of the index’s actual gain. Materials contributed slightly negatively in that analysis as precious metal miners surrendered earlier gains.
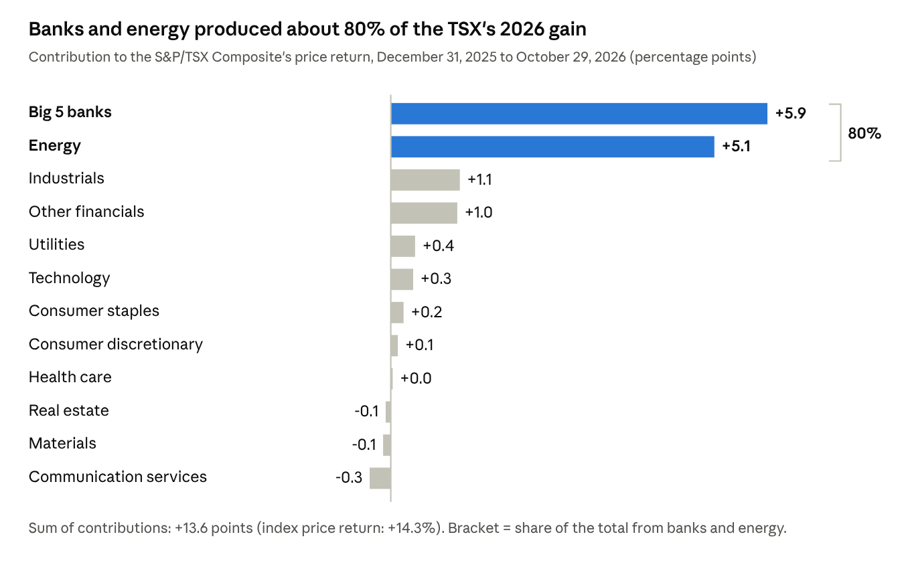
The Canadian figures reinforce the importance of looking beyond the index level. A strong year for banks and energy can coexist with weakness elsewhere. It also means that an investor’s sector mix can explain a substantial part of the difference between portfolio performance and the benchmark.
Sources: Quotestream Data, TSX closing prices and original constituent attribution
Why money kept rotating
Three forces have repeatedly changed the market’s direction. First, the Middle East conflict has kept energy prices and supply risks in focus. Brent reached US$116.72 in October before easing. News about renewed military action or diplomacy has quickly changed expectations for inflation, company costs and household spending. The continuing war in Ukraine adds uncertainty.
Second, inflation has complicated the outlook for interest rates. September consumer prices increased 3.7% from a year earlier in the United States and 3.1% in Canada. On October 28, the Federal Reserve held its target range at 3.75% to 4.00%, with two officials preferring an increase. The Bank of Canada raised its policy rate to 2.50%, citing the risk that persistent energy costs would spread into broader prices.
Third, AI remains both an opportunity and a source of doubt. Investors welcome spending on chips and data centres while questioning the eventual returns and the threat to established software businesses. The same development can benefit infrastructure suppliers and unsettle other technology companies.
These competing forces help explain why leadership has shifted so quickly. Markets are continually reassessing which businesses benefit from higher prices, which can absorb them and which depend most heavily on future growth.Our objective is to participate in growth while keeping risk consistent with client needs. That can mean lagging during periods of narrow leadership. We regard that tradeoff as preferable to increasing concentration simply because a small group has recently performed well. Frequent reversals make that discipline harder to maintain. A position that appears defensive during one episode can lag when sentiment changes, while an apparent recovery can fade after another headline. We continue to assess business fundamentals alongside market behaviour, rather than treating every short rally as confirmation of a lasting trend.
Sources: Statistics Canada September CPI; Federal Reserve October 28 statement; Bank of Canada October 28 decision; Quotestream Data October 26 market report; Admirals October 28 Fed review
The case for gains
We remain confident in our holdings and see a credible case for further market gains. Earnings provide support. FactSet’s October 23 report put blended third quarter revenue growth at 12.7%, combining reported results with estimates for companies yet to report. This suggests that the earnings outlook has support beyond cost reductions, although nominal revenue growth also reflects prices.
The approaching midterm election on Nov 3rd provides another reason for cautious optimism. A Motley Fool study using Robert Shiller’s US equity data back to 1874 found that markets rose over the following year after 32 of 38 midterm elections, or approximately 84% of the time. The average total return was 14%, including dividends, compared with approximately 11% across all 12 month periods in the study. These results suggest that election uncertainty has often been followed by a constructive period for investors.
The timing is instructive. Average gains were only 0.5% over the first month after midterms, with positive returns in 55% of cases. Over three months, the average gain reached 6%, and over six months it reached 10%, with positive returns in 76% and 87% of cases, respectively. The historical pattern therefore offers more support for patience over the following months than for expecting an immediate rally when the votes are counted.
Divided government is also relevant. When midterms produced a Republican president facing opposition control of at least one chamber of Congress, markets rose over the subsequent year in 13 of 14 cases, approximately 93%. In our view, greater legislative balance could make sweeping policy changes harder to enact and give businesses more room to plan. However, gridlock can also complicate budgets and negotiations, and an election outcome alone cannot resolve inflation or geopolitical risks.
Finally, weakness across individual stocks may already reflect considerable pessimism. Improving participation could allow previous laggards to contribute more. Lower oil prices, calmer geopolitical conditions or softer rate expectations would help, but we will look for sustained evidence before increasing conviction.
The breadth improvement is particularly relevant to diversified portfolios. If more businesses begin contributing to returns, the market would depend less on a handful of leaders. That would be a healthier backdrop for selecting companies on earnings and valuation, although a few stronger weeks do not establish that the transition is complete.
Sources: FactSet Earnings Insight dated October 23, 2026; The Motley Fool midterm analysis via WSOC TV
In Summary
This year has shown how strong headline returns can conceal a much more challenging market beneath the surface. Narrow leadership, sharp reversals and shifting expectations have rewarded concentration at times while testing the patience of diversified investors. Our response has been to maintain a disciplined balance between participating in growth and managing the risks that matter to our clients.
We remain confident in our holdings, with portfolios emphasizing income, defensive characteristics and exposure across sectors. Encouragingly, resilient economic activity, a strong earnings outlook and early signs of broader market participation provide reasons for optimism. If that improvement continues, opportunities could extend well beyond the handful of companies that have driven much of this year’s advance.
The midterm elections may bring greater policy clarity, and history offers an encouraging backdrop for the months that follow. Inflation, interest rates and developments in the Middle East will still influence the path ahead. As the evidence strengthens, we intend to add selectively to businesses offering attractive valuations, durable earnings and clearer prospects for growth.
We enter the coming months cautiously optimistic. Our diversified positioning allows us to participate today while retaining the flexibility to pursue emerging opportunities. We will continue to make those decisions patiently, with your income needs, tolerance for risk and longer term goals at the centre of our approach.
Thank you for your continued trust. We appreciate the opportunity to help guide you through changing markets and look forward to speaking with you soon.
This information has been prepared by Kian Ghanei, a Senior Portfolio Managers for iA Private Wealth Inc. and does not necessarily reflect the opinion of iA Private Wealth. The information contained in this newsletter comes from sources we believe reliable, but we cannot guarantee its accuracy or reliability. The opinions expressed are based on an analysis and interpretation dating from the date of publication and are subject to change without notice. Furthermore, they do not constitute an offer or solicitation to buy or sell any of the securities mentioned. The information contained herein may not apply to all types of investors. The [Investment Advisor/Portfolio Manager] can open accounts only in the provinces in which they are registered.
iA Private Wealth Inc. is a member of the Canadian Investor Protection Fund and the Investment Industry Regulatory Organization of Canada. iA Private Wealth is a trademark and business name under which iA Private Wealth Inc. operates.